

Keeping employees motivated, satisfied, and productive is one of the biggest challenges for any company. Disengaged employees can lead to higher turnover, absenteeism, and lower productivity, all of which cost the business money. An employee engagement dashboard helps HR teams and managers track how employees feel, spot issues early, and measure the impact of their initiatives. It turns data from surveys, attendance, and other HR tools into clear, actionable insights that improve employee experience and business outcomes.
In this guide, we’ll show you how to:
- Understand the cost of disengagement
- Track meaningful engagement metrics
- Build a dashboard that is simple, visual, and useful
- Avoid common pitfalls
- Use Factorial to make it easy and actionable
What is an Employee Engagement Dashboard?
An employee engagement dashboard is a visual tool that brings together all the data that shows how motivated, satisfied, and committed employees are at work. Think of it as a single place where HR teams and business leaders can see the “health” of their workforce.
Instead of digging through spreadsheets, survey results, or separate software tools, a dashboard combines the most important information into simple charts, scores, and trends. It often includes data on key HR metrics such as:
- Survey participation and results
- eNPS (Employee Net Promoter Score)
- Absenteeism trends
- Workload or burnout indicators
- Training completion stats
- 1:1 meeting frequency
- Turnover and retention metrics
- Team-by-team engagement comparisons
This type of employee metrics dashboard makes engagement measurable, which means companies can take action sooner, not later.
Who Uses Employee Engagement Dashboards?
Several roles rely on engagement dashboards because each of them benefits from a clearer picture of how people feel at work:
HR Managers
HR uses the dashboard to understand which teams need support, which engagement initiatives work, and where risks like burnout or turnover are emerging.
Team Managers
Managers can check how their team is doing compared to the company average and see what actions might improve workload balance, morale, or communication.
CEOs and Executives
Leaders use the dashboard to track culture health, monitor organizational risks, and confirm that investments in HR programs actually drive results.
CFOs
Finance teams care about engagement too, because disengagement has a direct cost. A dashboard helps them estimate financial impacts and model savings from improved engagement.
Why Do Employee Engagement Dashboards Matter?
An engagement dashboard matters because it turns something “soft” — emotions, morale, motivation — into something measurable and actionable.
Here’s the value it brings:
- Shows if employees are satisfied or at risk of disengaging
- Reveals whether HR programs are working, such as training, wellness programs, or manager development
- Helps companies spot early warning signs, like higher absenteeism or lower survey participation
- Connects people metrics to business outcomes, such as productivity, retention, and revenue impact
- Supports transparent decision-making, giving HR a stronger voice at the leadership table
In short, engagement dashboards help companies understand their people the same way they understand finances, sales, or operations through data.
The Real Cost of Disengagement
Disengagement often hides in the day-to-day, so companies underestimate how expensive it really is. But once you break the cost drivers into clear categories, the picture becomes much clearer and more urgent.
Below are the main drivers of disengagement-related costs and how they affect the bottom line.
1. Absenteeism
One of the biggest cost drivers, low engagement often leads to more sick leave, unplanned absences, and mental health days that aren’t openly communicated.
Each missed hour costs a company money. Not just in wages, but in lost productivity and increased workload for other teammates.
Impact:
- Delayed projects
- Frustrated team members
- Lower output across the department
Example:
If a disengaged employee misses 4 extra days per quarter, that adds up to more than 12 full workdays a year per person.
2. Presenteeism
Presenteeism happens when employees show up physically but not mentally. They might be tired, stressed, unmotivated, or simply burned out. Even if they’re at work, their productivity is much lower than expected.
Impact:
- Slow execution
- More mistakes to correct later
- Lower customer satisfaction
- Higher risk of burnout across teams
Presenteeism is often more expensive than absenteeism because it goes unnoticed and affects long stretches of time.
3. Turnover
Turnover is one of the biggest hidden drains on company budget. When disengagement rises, voluntary exits often follow.
Replacement cost includes:
- Recruiting
- Interview time
- Onboarding
- Training
- Temporary backfill or overtime
Most studies estimate that replacing an employee costs between 1.5 to 2 times their annual salary, depending on the role.
4. Unsuccessful Onboarding
New hires who aren’t engaged during onboarding take longer to reach full productivity. Some never fully ramp at all.
Impact:
- Productivity delays
- Additional coaching hours
- Higher risk of quitting within 3 to 6 months
Poor engagement early on can double the time it takes for a new hire to add value.
5. Overtime and Backfill Costs
When disengaged employees underperform or miss time, someone else has to pick up the slack, usually through overtime or temporary help.
Impact:
- Increased labor costs
- Team burnout from covering extra duties
6. Low Productivity and Missed Revenue
Engaged employees are more creative, productive, and proactive. Disengaged employees, on the other hand, do the minimum required and rarely contribute new ideas or improvements.
Impact:
- Lower output
- Missed upsell opportunities
- Reduced customer service quality
- Slower innovation
Over a year, these losses can be massive, especially on customer-facing teams.
Annual Disengagement Cost Formula
To understand the real financial impact of low engagement, HR and Finance teams can use this standard calculation:
Annual Disengagement Cost ≈
(Absenteeism hours x Average loaded labor rate)
(Voluntary turnover x replacement cost per hire)(Productivity deficit % x total compensation of impacted roles)
Below you can find the terms explained in more detail.
1. Absenteeism Cost
Disengaged employees typically have higher unplanned absenteeism, which includes sick days, no-shows, and short-notice leave.
Cost = Excess absenteeism hours x Average loaded labor rate
The loaded labor rate is the true hourly cost of an employee, including:
- Base salary
- Employer payroll taxes
- Benefits
- Employer-sponsored insurance
- Facilities and technology overhead
2. Voluntary Turnover Cost
Lower engagement increases voluntary turnover, which is expensive because of the costs of replacing an employee.
Cost = Number of voluntary separations x average replacement cost per hire
The replacement cost includes:
- Recruitment and sourcing
- Interview and assessment time
- Onboarding and training labor
- Lost productivity during ramp-up
- Temporary backfill or overtime coverage
3. Productivity Deficit Cost
Disengaged employees experience a measurable productivity deficit, often 20 – 30% below expected performance levels.
Cost = Productivity deficit % x total compensation of affected staff
“Total compensation” includes salary, bonuses, and benefits for all employees experiencing decreased performance.
How Dashboards Make HR’s Work Visible
One of the biggest challenges HR teams face is proving the impact of their work. Many HR initiatives (like recognition programs, training, manager coaching, or wellbeing activities) take time to show results. Without clear data, it’s hard for HR to demonstrate what’s working, what needs attention, and how their efforts contribute to overall business performance.
This is where an employee engagement dashboard becomes a powerful tool. It turns HR’s work into clear, measurable outcomes that leaders across the company can understand.
Here’s how dashboards bring visibility to HR operations:
1. Dashboards Show Trends Over Time
Dashboards display how engagement scores, participation rates, and employee sentiment change month by month or quarter by quarter.
This helps HR answer questions like:
- Are employees feeling more supported after a new program launch?
- Did engagement dip after an organizational change?
- Which teams are improving, and which are struggling?
Seeing these patterns helps HR react early instead of waiting until problems become crises.
2. They Connect Engagement Activities to Results
With a dashboard, HR can track how actions lead to outcomes. For example:
- Did a wellbeing program lead to fewer absences?
- Did manager training improve team eNPS?
- Did more 1:1 meetings reduce turnover?
3. They Reveal Team-Level Differences
Engagement is never the same across all teams.
Dashboards let HR compare:
- Departments
- Roles
- Locations
- Seniority groups
Seeing these differences helps leaders identify where extra support or training is needed.
4. They Track Key People Processes
Dashboards make it easy to monitor behaviors that drive engagement, such as:
- Survey participation
- Issue resolution time (how fast concerns are addressed)
- Training completion
- Manager 1:1 meeting cadence
- Goal and OKR progress
These indicators show whether engagement-building habits are happening consistently.
Read our article on unique engagement survey questions to prepare your next survey!
5. They Make People Data Easy to Understand
The basis of a successful people strategy is a proper understanding people data. Instead of long reports or spreadsheets, dashboards present information visually through charts, heatmaps, and simple scores. This helps executives get an instant read on culture health without needing to interpret raw data.
6. They Strengthen HR’s Impact on the Company
When HR can clearly connect engagement levels to absenteeism, turnover, productivity, and cost savings, their recommendations carry more weight. Dashboards make HR’s work visible, measurable, and aligned with business goals.
Try our free employee satisfaction survey template to understand the importance of getting to know how your people feel.
Must-Have Engagement Metrics
To create an effective employee engagement dashboard, you need metrics that show how people feel, how they behave, and how engagement influences performance. Below are the core metrics every company should track, along with guidelines on how to set targets.
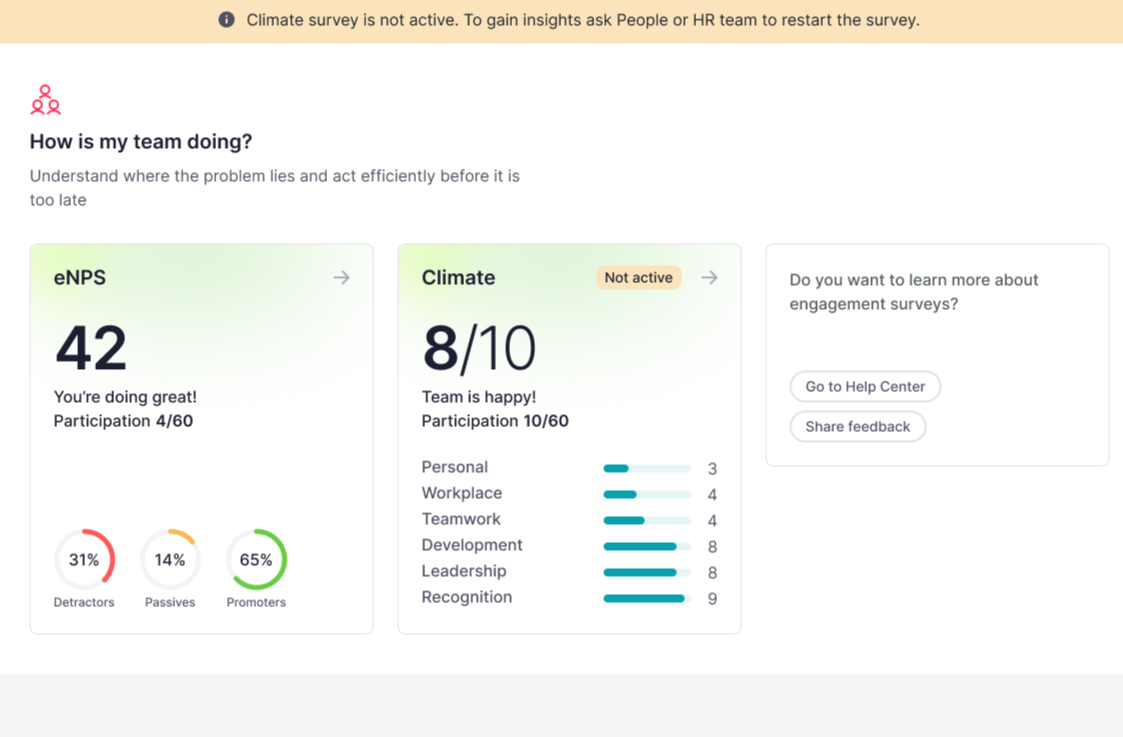
1. Employee Net Promoter Score (eNPS)
What it measures: How likely employees are to recommend the company as a workplace.
Setting a target: Aim for a score that reflects steady improvement over time and is consistently above industry norms for your sector.
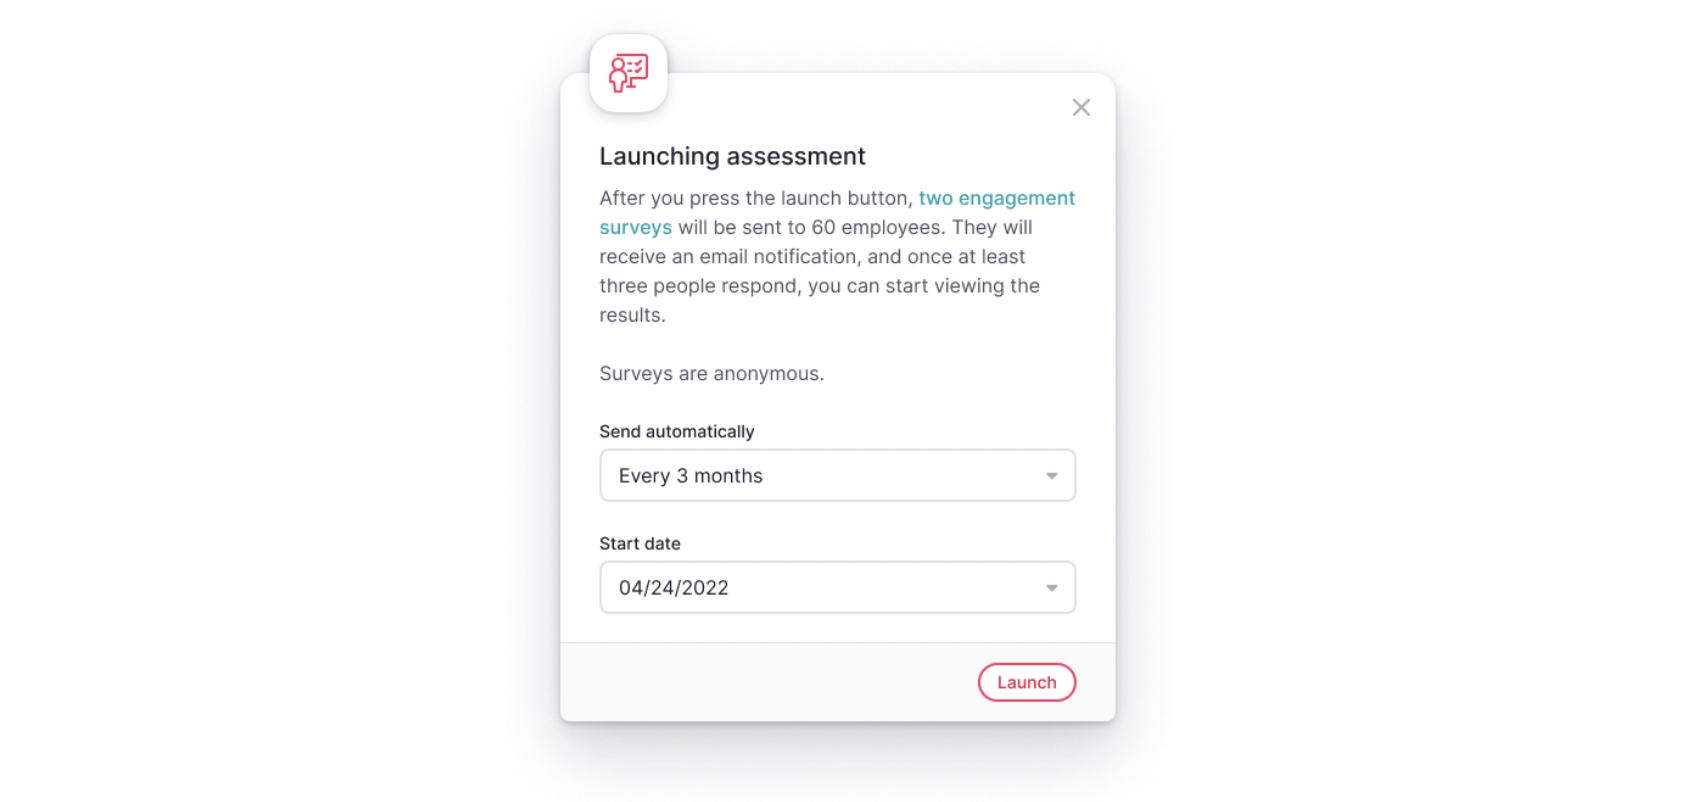
2. Climate or Engagement Survey Score
What it measures: Employee sentiment across categories like leadership, communication, recognition, workload, and team culture.
Setting a target: Set a goal for continuous quarter-over-quarter improvement and identify an acceptable range that aligns with your company culture and past results.
3. Absenteeism Rate
What it measures: The percentage of planned work time employees miss unexpectedly.
Setting a target: Track absenteeism in relation to your organization’s historical trends and aim to keep it stable or decreasing over time.
4. Turnover (Voluntary & Involuntary)
What it measures: The percentage of employees who leave the company.
Setting a target: Establish a target that balances healthy movement with retention — typically lower than your previous year’s trend and aligned with what’s sustainable for your team structure and industry.
5. New Hire Ramp-Up Progress
What it measures: How quickly new employees reach expected performance levels.
Setting a target: Look for consistent improvement in ramp-up speed and set expectations based on role complexity and your past onboarding data.
6. Manager 1:1 Cadence
What it measures: How regularly managers hold structured one-on-one meetings with team members.
Setting a target: Define a cadence that supports your culture — typically frequent enough to maintain trust, alignment, and support, without overloading managers.
7. Training & Development Completion
What it measures: Employee participation in required and optional development programs.
Setting a target: Required training should have high completion, while optional programs should show steady participation growth as engagement improves.
8. Internal Mobility Rate
What it measures: The percentage of new roles filled by existing employees.
Setting a target: Set an internal mobility goal that encourages career development — one that reflects your company’s structure, size, and growth path.
9. Issue Resolution Time
What it measures: How quickly HR or managers resolve employee concerns.
Setting a target: Establish a response standard that ensures timely, reliable support and reflects the complexity of different issue types.
10. Participation in Engagement Activities
What it measures: How many employees join cultural initiatives, feedback sessions, or wellbeing programs.
Setting a target: Monitor participation for steady improvement, and ensure engagement activities reach a broad, diverse mix of employees—not just the most active or vocal.
11. Productivity Index (Team-Level)
What it measures: How effectively teams meet goals, deliver work, or complete projects.
Setting a target: Set expectations based on your company’s pace, project demands, and team capacity — aiming for consistency and gradual performance improvement.
Step-by-Step: Build Your Engagement Dashboard
Creating an employee engagement dashboard doesn’t have to be complicated. Follow these simple steps to make a dashboard that managers and leaders will actually use.
1. Define Your Key Questions
Start by asking what you want to learn. For example:
- Which teams are at risk of low engagement?
- Are managers having regular 1:1s with their teams?
- Which issues need immediate attention?
These questions guide which metrics to track.
2. Choose Your KPIs
Pick the metrics that answer your questions. For example, to spot burnout, you might track:
- Survey scores
- Absenteeism
- Overtime hours
- Manager 1:1 frequency
Keeping it focused with fewer, meaningful KPIs is better than using many confusing ones.
3. Standardize Your Metrics
Make sure everyone measures metrics the same way:
- Define each metric clearly
- Explain how it’s calculated
- Set thresholds for what’s healthy, concerning, or risky
This ensures the dashboard is reliable and trusted.
4. Gather Your Data
Collect information from:
- HR systems
- Survey tools
- Time tracking or payroll
- Training platforms
Organize it so your dashboard has a single, clean source of truth.
5. Design the Dashboard Layout
Show information in a way that’s easy to read:
- Executives: high-level trends and risks
- Managers: team-level details and actions
Use clear charts, summaries, and trend visuals.
Common Pitfalls (and How to Avoid Them)
Even the best dashboards can fail if you fall into common traps. Here are the main pitfalls to watch for:
1. Vanity Metrics
Tracking numbers that look good but don’t drive action. Focus on meaningful metrics that show real engagement and impact, like turnover, absenteeism, and survey trends.
2. No Ownership
If no one is responsible for the dashboard, it won’t be updated or used. Assign a clear owner in HR or People Analytics to maintain and monitor it.
3. Stale Data
Old or outdated data hides real problems. Update your dashboard regularly to reflect the current state of engagement.
4. Over-Complicated Visuals
Too many charts, colors, or layers make it hard to understand. Keep visuals simple, clear, and focused on actionable insights.
5. Ignoring Cohort Gaps
Looking only at overall averages can hide issues in specific teams, roles, or locations. Break down data by cohorts to spot and address team-level challenges.
How Factorial Helps You
Building and maintaining an employee engagement dashboard can feel complicated. Factorial’s HR Reports feature makes it simple, fast, and actionable.
1. All-in-One Platform
Factorial brings together surveys, HR data, and engagement metrics in one place. No need to juggle spreadsheets or multiple tools.
2. Quick Setup
You can set up your dashboard in minutes and start seeing insights immediately.
3. AI-Powered Insights
Factorial’s AI, called One, helps you understand trends and engagement patterns quickly. It can even co-create surveys tailored to your teams, roles, or departments.
4. Easy Action Plans
With clear metrics and insights, managers and HR can take action fast improving engagement, spotting risks early, and reducing costly disengagement.
Factorial makes engagement dashboards simple, visual, and useful, so HR can focus on improving the employee experience instead of wrestling with data.
Employee Engagement Dashboard FAQs
1. What are the 5 C’s of employee engagement?
They are key elements that drive engagement, namely Clarity, Commitment, Connection, Confidence, and Contribution.
2. What are the 4 P’s of employee engagement?
These are the factors that influence motivation and satisfaction, that is Purpose, Pride, People, and Performance.
3. What are the 7 factors of employee engagement?
Leadership, Communication, Work Environment, Recognition, Growth, Work-Life Balance, and Job Role Alignment.
4. What is a KPI for employee engagement?
A measurable indicator of engagement, such as eNPS, survey participation, turnover rate, or absenteeism.